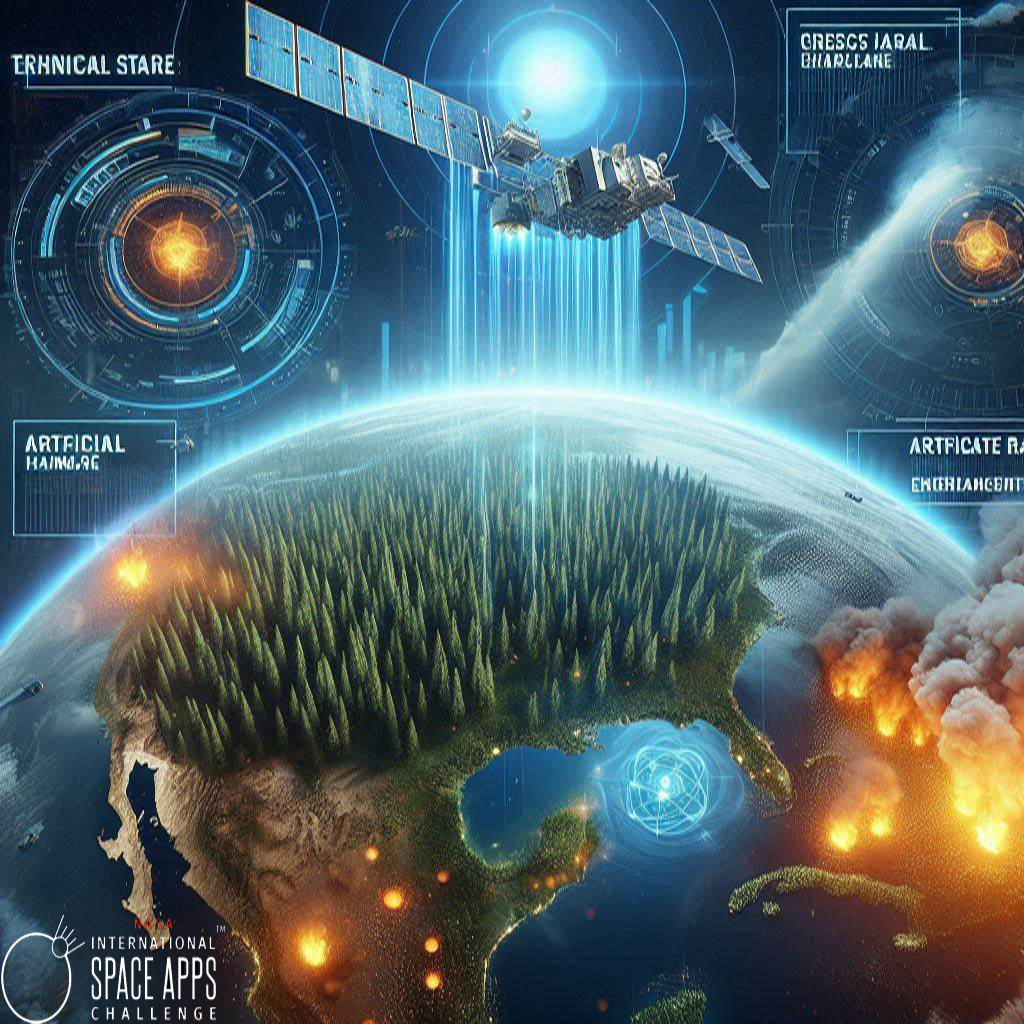
Uncover the Role of Greenhouse Gases in Your Neighborhood!

Human-caused (anthropogenic) greenhouse gas emissions and natural systems that produce and absorb greenhouse gases (sources and sinks) interplay in a complicated manner to contribute to global climate change. As policymakers and citizens race to combat climate change, understanding this interplay is more important than ever. Your challenge is to use a combination of satellite and model-based datasets to map both human-caused and natural greenhouse gas emissions to enable better understanding of how these emissions contribute to a warmer world.

Background

Human emissions of greenhouse gases (GHG), most notably carbon dioxide (CO2) and methane (CH4), are the main driver of climate change. Together, these two gases have increased the atmosphere’s ability to trap heat by 80% relative to pre-industrial times. Due to increasing concentrations of greenhouse gases, the past 10 years have been the warmest years on record, resulting in changes in extreme weather, rising sea levels, and increased threats to food and water security in many regions. The U.S. Greenhouse Gas Center (US GHG Center), an interagency effort initiated by the White House in 2023, aims to make data on climate change available and accessible to all. The center currently focuses on three main topics.

Topic 1: Human-caused Emissions

  • Carbon dioxide: Carbon dioxide (CO2) is an important GHG that comes from the extraction and burning of fossil fuels (such as coal, oil, and natural gas), from wildfires, and from natural processes like volcanic eruptions. Since the onset of industrial times in the 18th century, human activities have raised atmospheric CO2 by 50% – meaning the amount of CO2 is now 150% of its value in 1750. This human-induced rise is greater than the natural increase observed at the end of the last ice age, 20,000 years ago.
  • Methane: A potent greenhouse gas, methane (CH4) is responsible for about one third of all global warming that results from human activities. Methane also traps more heat than carbon dioxide and has a relatively shorter lifetime in our atmosphere, which makes finding and limiting methane emissions one of the best opportunities for reducing climate change. Locating and mapping U.S. sources of methane emissions can provide insights into recent emission trends and improve national estimates. Detailed maps also allow for more direct comparisons of methane emissions from inventories and those calculated from atmospheric observations, thereby helping to improve the information used to track progress towards our collective climate goals.
  • More information is available on the US GHG Center website.
    Topic 2: Natural GHG Sources and Sinks

  • Absorption of emissions by natural systems: Atmospheric CO2 increases represent a balance between fossil fuel emissions and land and ocean carbon sinks, which absorb about half of human emissions each year. Without this valuable assistance from the natural world, CO2 would be accumulating in the atmosphere much more rapidly, accelerating the risks posed by climate change. However, scientists are unsure how long this 50% “discount” on CO2 emissions will continue since ecosystems are threatened by wildfires, droughts, floods, and other climate-related hazards.
  • GHG emissions from natural systems: Though CH4 is emitted from a variety of human activities (oil and natural gas production and use, agriculture, waste), about 30% of global emissions come from natural sources. Emissions from microbial sources like wetlands can increase as global temperatures warm and the health of many coastal wetland areas are threatened by rising sea levels.
  • Policy and scientific challenge: The path to addressing climate change relies on reducing human-caused emissions and preserving or even enhancing the ability of natural carbon sinks to remove CO2 from the atmosphere. To enable policymakers to set emissions reduction targets that limit warming and to manage the critical ecosystems that have helped slow climate change to date, high quality, spatially detailed information about the location and vulnerability of natural sources and sinks around the world is urgently needed.
  • More information is available on the US GHG Center website.
    Topic 3: Large Emission Events

  • Methane emissions: Methane is a flammable gas that is invisible to the human eye. Natural gas has a methane content of around 95% in the United States. Because it is used widely for heating and cooking there are distribution systems for natural gas throughout our cities and towns. While most methane emissions come from the waste sector (landfills, wastewater treatment), and agriculture (livestock and rice farming) methane is also released during coal mining and the production, transport, and processing of oil and natural gas.
  • Methane leaks: Methane emission prevention activities like leak detection and repair enable emission mitigation. Burning methane by flaring—a technique that is often used during the oil extraction and refining process—can help eliminate methane emissions, but creates CO₂, which is also a greenhouse gas, but one that is a less potent contributor to climate change than methane. Increasingly, industrial entities such as landfills and wastewater management organizations capture the methane they produce and burn it either to generate electricity or to prevent it from entering the atmosphere. This practice can also reduce toxic gases like benzene that often occur along with methane.
  • More information is available on the US GHG Center website.

    Objectives

    Your challenge is to use a combination of satellite and model-based datasets to map both human-caused and natural greenhouse gas emissions to enable better understanding of how these emissions contribute to a warmer world. By using innovative combinations of satellite and model data, your project could enable new insights and approaches that help users—including communities and decision-makers—better understand the three focus areas described above (human-caused GHG emissions, natural sources and sinks of GHG emissions, and large GHG emission events).

    There are numerous ways to approach this challenge (see the Potential Considerations below for some example approaches you could take). Will your maps reflect data on a neighborhood scale or a global scale? Think about how you could help provide high-quality GHG information to decision-makers to assist them in their fight against climate change.

    You can use the datasets provided on the GHG Center data portal and if you choose, you can combine that data with additional satellite information to provide the higher spatial resolution data needed for certain policy and scientific applications.

    Potential Considerations

    You may (but are not required to) consider the following:

    General Considerations:

  • The format of maps on the GHG Center data portal—e.g., cloud-optimized geotiffs with metadata that describe basic features of the data including units, temporal frequency, and spatial resolution—is very useful. Consider using a similar format for your maps.
  • Don’t forget to use traceable methods that are well documented, and open-source data to develop your solution.
  • Think about how you can ensure that the total mass of emissions is accurately conserved at regional and global scale. For example, if a 50-km estimate of wetland emissions is re-allocated to 500m pixels using satellite data, the higher resolution emissions must add up to the original totals.
  • Take care to make sure downscaling approaches deliver reasonable, common-sense results in complex areas –for example, in and around cities and near coasts.
    Considerations for Topic 1: Human-Caused Emissions. Possible approaches and considerations for the human-caused emissions category include:

  • Adding Graphic User Interface (GUI) elements (e.g., icons, menus) to python tools so that users can run the tools without knowing python.
  • Developing a tool where users input a country and get the country's total emissions.
    Including automated updates for plumes detected over a specific region. The system could send alerts to users with the information if a plume in the region is detected.
  • Generating a mapping tool that would allow plume imagery to be viewed in a geospatial environment with latitude and longitude information that could allow users to find a plume source in real time.
  • Incorporating other mapping tools that could pull data from the U.S. GHG Center and plot the data. Additional features to consider include allowing overlaying and combining of datasets.
    Considerations for Topic 2: Natural Sources and Sinks. Possible approaches and considerations for the natural sources and sinks category include:

  • Providing high-quality land-atmosphere exchange for CO2 or CH4 wetland emissions at land management spatial scales (finer than 1 km) using open-source data and science principles.
  • Because GHG emissions cannot be measured directly except at very local scales, source and sink estimates provided on the data portal are computed by advanced numerical models, which run at much coarser spatial scales. “Downscaling” approaches combine coarser resolution model estimates with finer resolution satellite data for related variables (e.g., vegetation greenness, land surface type, inundated area) to create the higher resolution datasets many users need. Such products often leverage artificial intelligence or machine learning (AI/ML), though such approaches are not required.
  • You can develop a solution that uses global data or analyzes a smaller region of interest (e.g., your home country, state, or favorite landmark).
    Considerations for Topic 3: Large Emission Events. Possible approaches and considerations for the large emission events category include:

  • Providing automated updates for NASA’s Earth Surface Mineral Dust Source Investigation (EMIT) methane plume data based on a user-specified location of interest, like a state, country, or specified bounding box. Users could be alerted to new methane plume observations for the location of interest, including the visualized plume and the date/time of observation.
  • Incorporating automated generation of plume animations showing plume evolution over time (i.e., plume rotations, changing magnitudes, intermittence versus persistence).
    Definitions (adapted from NASA and IPCC)

  • Greenhouse Gasses (GHGs): gasses in the atmosphere that trap heat from the Sun.
  • Fossil Fuel: Any hydrocarbon (chemical containing only carbon and hydrogen) deposit that can be burned for heat or power, such as petroleum, coal, and natural gas.
  • Carbon Dioxide (CO2): A naturally occurring gas, CO2 is also a byproduct of burning fossil fuels (such as oil, gas, and coal), of burning biomass, of land-use changes (LUCs) and of industrial processes (e.g., cement production). It is the main gas contributing to climate change.
  • Methane (CH4): A greenhouse gas that is the major component of natural gas and is associated with all hydrocarbon fuels. Significant human-caused methane emissions also occur as a result of some agriculture activities. Methane is also produced naturally where organic matter decays under anaerobic (without oxygen) conditions, such as in wetlands.
  • GHG Source: Something that releases a greenhouse gas into the atmosphere. For example, the burning of fossil fuels is a source of GHG emissions.
  • GHG Sink: Something that removes a greenhouse gas from the atmosphere. For example, plants—through photosynthesis—transform carbon dioxide in the air into organic matter, which either stays in the plants or is stored in the soils. Thus, plants are a sink for carbon dioxide.
  • Carbon Budget:
  • Global Carbon Budget: the assessment of global carbon sources and sinks, and the resulting change in atmospheric CO2 concentration.
  • Total Carbon Budget: the maximum amount of net global human-caused CO2 emissions that would result in limiting global warming to a given level.
  • Top-down Estimates: source and sink estimates derived from atmospheric observations.
  • Bottom-up Estimates: source and sink estimates derived from land and ocean models or activity data.
  • Lateral Fluxes: the flow of carbon between different types of sources and sinks (e.g., lateral flow of agricultural products from growth to consumption, riverine transport of soil carbon from land to ocean systems).

    For data and resources related to this challenge, refer to the Resources tab at the top of the page. More resources may be added before the hackathon begins.

  • {parents:idea_english_title}
    Medina
    Sep 08, 2024
    Uncover the Role of Greenhouse Gases in Your Neighborhood!

    Uncover the Role of Greenhouse Gases in Your Neighborhood!

    "أن الثورة التكنولوجيه التي يشهدها العالم اليوم شملت جميع مرافق الحياة المختلفة بما في ذلك الجانب الصناعي ، حيث اخذت النشاطات الصناعية بالتزايد والتوسع الكبيرين ، مما أدى الى التأثير على البيئة التي يعيشها الانسان بشكل سلبي . حيث يلاحظ بأن طبقة التروبوسفير قد بدأت تتغير ويختل توازنها بسببب زيادة حجم الملوثات ، وهذه المشكله في التلوث تعود الى عدة اسباب منها استغلال واستنزاف موارد الطاقه ، كالفحم والطاقه النووية وزيادة تركز السكان والصناعات في المدن . فالصناعة تعد من الاسباب الرئيسية للتلوث إلا انه لا غنى عنها للتنمية في قطرنا لذا يجب التقليل من اثر التلوث المنبعث منها، وهذا يتطلب اجراء المزيد من الدراسات والمسوحات الدقيقة لما يوجد في المدن منها حاليا او على مقربه منها وما تبعثة من فضلات وابخرة ومواد وغازات سامه وتأثيراتها على البيئة . هدف البحث التعرف على الاضرار التي نتجت من دخان المصانع وكيفية حل هذه المشكلة، هنالك مشاكل كثيره نتجت بسبب دخان المصانع مما لا يساعد على سرعة تحقيق رؤية 2030 وهي (البيئة الصحية) . الجمهور المستهدف : تم أستهداف المجتمع بأكمله لكونه يعاني من دخان المصانع "

    Our team needs 2 members
    Request to Join the Team
    {parents:idea_english_title}
    albaha
    Sep 08, 2024
    Uncover the Role of Greenhouse Gases in Your Neighborhood!

    Uncover the Role of Greenhouse Gases in Your Neighborhood!

    تطوير برنامج يدعم الذكاء الاصطناعي وGIS يجمع بين البيانات المناخية العالمية والتغيرات الناتجة عن التوسع العمراني. سيعمل هذا النظام على التنبؤ بالأحداث المناخية القاسية (مثل الأعاصير والفيضانات وموجات الحر) في المناطق الأكثر تعرضًا للخطر بسبب زيادة انبعاثات الغازات المسببه للاحتباس الحراري الناجمة عن الأنشطة الحضرية ويقوم بتحديد المناطق الاقل عرضه للخطر لتصميم المناطق السكنيه بتقنيات البقاء المستدامه.

    Our team needs 3 members
    Request to Join the Team
    {parents:idea_english_title}
    Medina
    Sep 08, 2024
    Uncover the Role of Greenhouse Gases in Your Neighborhood!

    Uncover the Role of Greenhouse Gases in Your Neighborhood!

    بينما الأغلب يحاول صنع خرائط تفاعلية على مستوى محلي لرصد تركيز الغازات الدفيئة، سنقوم هنا بتغيير الزاوية قليلاً حيث ان " رابِل " لن يكون مجرد خريطة تفاعلية بل سيكون نظام متكامل يظهر رؤية شاملة لجميع العوامل المؤثرة في المناخ ،وسيكون أداة لدراسة العلاقة المعقدة بين هذه العوامل ، سوف نركز على إظهار كيف يعمل الكون مما يتيح لنا فرصة لأكتشافات علمية جديدة ! هل هناك عوامل اخرى غير تقليدية تقوم بالتأثير على تركيز الغازات الدفيئة ؟ ...، واخيراً سنقدم حلول مبتكرة وواقعية لتكون أثر حقيقي على الأرض ، أطمح ان يستفيد الباحثين من خريطتنا كما السياسين وصُناع القرار في منطقة ما.

    Our team needs 5 members
    Request to Join the Team
    {parents:idea_english_title}
    Riyadh
    Sep 08, 2024
    Uncover the Role of Greenhouse Gases in Your Neighborhood!

    Uncover the Role of Greenhouse Gases in Your Neighborhood!

    يهدف مشروع "على خطى النبي" إلى تشجير طريق الهجرة النبوية من خلال زراعة 280 مليون شجرة على مساحة 45000 هكتار. يعتمد المشروع على تكنولوجيا الفضاء، مثل الأقمار الصناعية، لتحديد المواقع المثلى للتشجير ورصد التغيرات البيئية. باستخدام برنامج QGIS لتحليل البيانات الجغرافية، يسعى المشروع إلى تحسين جودة الهواء وتقليل انبعاثات الكربون بمقدار 6.16 مليون طن سنويًا. يهدف إلى تعزيز التنوع البيولوجي ودعم المجتمع المحلي من خلال توفير فرص عمل وزيادة الدخل. يتماشى المشروع مع رؤية السعودية 2030 لتعزيز الاستدامة البيئية وتحقيق التنمية المستدامة، مستلهمًا من القيم النبوية.

    Our team needs 2 members
    Request to Join the Team
    {parents:idea_english_title}
    Tabuk
    Sep 08, 2024
    Uncover the Role of Greenhouse Gases in Your Neighborhood!

    Uncover the Role of Greenhouse Gases in Your Neighborhood!

    "## **اقتراحات لتطبيق ""اكتشف دور الغازات المسببة للاحتباس الحراري في منطقتك!""** ### **الفكرة الأساسية:** يهدف التطبيق إلى توعية المستخدم بأثر تغير المناخ على بيئته المحلية، وتمكينه من اتخاذ خطوات عملية للمساهمة في الحد من انبعاثات الغازات الدفيئة. ### **الميزات الرئيسية:** * **حساب الأثر الكربوني الشخصي:** يسمح للمستخدم بتقدير بصمته الكربونية من خلال إدخال بيانات بسيطة عن نمط حياته. * **استكشاف مصادر الانبعاثات المحلية:** يعرض خريطة تفاعلية للمصادر الرئيسية للانبعاثات في المنطقة. * **نصائح عملية:** يقدم نصائح مخصصة للمستخدم للحد من انبعاثاته. * **تحديات ومكافآت:** يحفز المستخدم على اتخاذ إجراءات مستدامة من خلال نظام مكافآت. ### **الجمهور المستهدف:** * **الأفراد المهتمون بالبيئة:** الطلاب، العائلات، المهتمون بالاستدامة. * **صناع القرار المحلي:** المسؤولون عن البلديات والمناطق. ### **كيفية العمل:** 1. **التسجيل:** يقوم المستخدم بتسجيل حساب وإدخال بعض المعلومات الأساسية. 2. **حساب الأثر الكربوني:** يدخل المستخدم بيانات عن نمط حياته (النقل، التغذية، الطاقة) ويحصل على تقدير لانبعاثاته. 3. **استكشاف المنطقة:** يستعرض المستخدم الخريطة التفاعلية لمعرفة مصادر الانبعاثات في منطقته. 4. **الحصول على نصائح:** يتلقى المستخدم نصائح مخصصة للحد من انبعاثاته. 5. **المشاركة في التحديات:** ينخرط المستخدم في تحديات مع أصدقائه. ### **الوصف القصير:** **""اكتشف تأثيرك على كوكبنا!""** تطبيق يمكّنك من فهم بصمتك الكربونية واقتراح طرق عملية للحد منها. استكشف مصادر الانبعاثات في منطقتك وتعلم كيف تساهم في بناء مستقبل أكثر استدامة. ### **المميزات الفريدة:** * **شخصي:** يقدم نصائح مخصصة لكل مستخدم. * **تفاعلي:** يوفر تجربة ممتعة من خلال التحديات والمكافآت. * **محلي:** يركز على التأثيرات المحلية لتغير المناخ. "

    Our team needs 4 members
    Request to Join the Team
    {parents:idea_english_title}
    Jeddah
    Sep 08, 2024
    Uncover the Role of Greenhouse Gases in Your Neighborhood!

    Uncover the Role of Greenhouse Gases in Your Neighborhood!

    تهدف هذه الدراسة الى التعرف على اسباب المشکلة وسبل المواجهة من خلال برامج بالتخفيف والتکييف. الى جانب تعزيز وتيرة التنمية المستدامة في الدول ، بما في ذلك تحقيق الأهداف الإنمائية للمحافظة على حماية البيئة من الاحترار الأرضي .

    {parents:idea_english_title}
    Dhahran
    Sep 08, 2024
    Uncover the Role of Greenhouse Gases in Your Neighborhood!

    Uncover the Role of Greenhouse Gases in Your Neighborhood!

    "الحي الودود": لعبة تفاعلية مبتكرة تهدف لزيادة الوعي حول تغير المناخ. تستهدف الطلاب، المهتمين بالبيئة، وصناع القرار. تتميز بتركيزها المحلي، واستخدامها لبيانات علمية دقيقة، وتجربة لعب جذابة، وتشجيعها على اتخاذ إجراءات إيجابية. نثق بقدرتها على إحداث تأثير كبير في فهم قضية التغير المناخي وبناء مستقبل مستدام.

    Our team needs 1 members
    Request to Join the Team
    {parents:idea_english_title}
    Bisha
    Sep 08, 2024
    Uncover the Role of Greenhouse Gases in Your Neighborhood!

    Uncover the Role of Greenhouse Gases in Your Neighborhood!

    This project aims to develop a smart program leveraging artificial intelligence and the Internet of Things to monitor air quality in tourist areas. The program will enable the tracking of harmful emissions and provide accurate analyses of pollution levels in real-time. It includes the creation of interactive maps that utilize a color-coded system to illustrate pollution levels, allowing both visitors and government agencies to make informed decisions regarding public health and safety. Additionally, the program will analyze historical data to offer future predictions on air quality, helping to identify potential risks and plan appropriate preventive measures.****

    Our team needs 5 members
    Request to Join the Team