Landsat missions have provided the longest continuous dataset of remotely sensed measurements of Earth’s land surface. Comparing ground-based spectral measurements with Landsat Surface Reflectance (SR) data collected at the same time can facilitate experiential learning, encourage scientific exploration with satellite data, foster interdisciplinary and spatial thinking skills, and empower individuals to become informed global citizens. But to compare ground-based measurements with Landsat data, you need to know when Landsat will be passing over a specific land area, and then be able to access the Landsat data collected at that place and time. Your challenge is to develop a web-based application that supports the comparison of ground-based observations with Landsat data by allowing users to define a target location, receive notifications when Landsat is to pass over that location, and then access and display the corresponding Landsat SR data.
Background
The Landsat Program, administered by NASA and the U.S. Geological Survey, has improved our understanding of Earth systems, helped monitor environmental change, and informed decision-making about our planet’s natural resources. Landsat’s data archive provides the longest continuous remotely sensed record of multispectral, highly calibrated, medium spatial resolution (15 ⎼ 100 m) measurements of Earth’s land surface. The two most recent missions, Landsat 8 (launched in 2013) and Landsat 9 (launched in 2021), collectively deliver complete coverage of Earth’s land surface every eight days.
Free and open data from Landsat offers over fifty years of satellite-based Earth observations to engage members of the public and enable them to learn how Earth is changing. For example, students can compare Landsat data with ground-based spectral measurements from low-cost, educational tools they build themselves (e.g., the Science and Technology Education for Land/Life Assessment STELLA spectrometer). Comparing ground-based measurements with Landsat data can help students connect satellite observations with the landscape, enhance remote sensing education, and cultivate an understanding of data validation. Validation is the process of evaluating the accuracy of satellite-derived data through comparisons with ground reference data. This practice ensures that measurements collected by space-based sensors accurately represent what is happening on the ground. Validation is an essential component of any Earth observation program since it enables the independent verification of physical measurements.
To compare ground-based spectral data with Landsat data, it is necessary to know when Landsat will pass over a certain land area. An application that notifies users when Landsat will pass over a designated area and allows them to download the corresponding Landsat spectral data can inspire experiential learning activities to encourage scientific exploration, foster interdisciplinary and spatial thinking skills, and empower individuals to become informed global citizens.
While such an application could primarily serve as an educational tool, it could also support scientists, citizen scientists, and land managers. For example, it could facilitate the acquisition of near-real-time Landsat SR measurements, which could then be accessed, downloaded, and applied by other Landsat data users. Additionally, this application could support scientists in the collection of ground reference data to further Landsat data validation.
Objectives
Your challenge is to develop an easy-to-use, web-based application that supports the comparison of ground-based observations with Landsat data by allowing users to define a target location, receive notifications when Landsat is to pass over that location, and then access and display the corresponding Landsat SR data.
Think about how your tool can:
Allow users to define the target location. Will they specify the place name, latitude and longitude, or select a location on a map?
Determine when a Landsat satellite is passing over the defined target location.
Enable users to select the appropriate lead time for notifications about the overpass time and the method of notification.
Display a 3x3 grid including a total of 9 Landsat pixels centered on the user-defined location (target pixel).
Determine which Landsat scene contains the target pixel using the Worldwide Reference System-2 (WRS-2) and display the Landsat scene extent on a map.
Allow users to set a threshold for cloud coverage (e.g., only return data with less than 15% land cloud cover).
Permit users to specify whether they want access to only the most recent Landsat acquisition or acquisitions spanning a particular time span.
Acquire scene metadata such as acquisition satellite, date, time, latitude/longitude, Worldwide Reference System path and row, percent cloud cover, and image quality.
Access and acquire Landsat SR data values (and possibly display the surface temperature data from the thermal infrared bands) for the target pixel by leveraging cloud data catalogs and existing applications.
Display a graph of the Landsat SR data along the spectrum (i.e., the spectral signature) in addition to scene metadata.
Allow users to download or share data in a useful format (e.g., csv).
These are only some of the functions your tool could perform. Feel free to be creative and add expanded functionalities to create an even more effective and integrated application!
Potential Considerations
You may (but are not required to) consider the following:
Use and Accessibility: Think about how to ensure your application can be optimized for and responsive to mobile devices. Don’t forget to be mindful of load times and follow basic 508 compliance requirements.
Location selection: Your tool could allow users to select a target location based on their current location or select multiple locations prior to going into the field where cell phone service might be weak or non-existent.
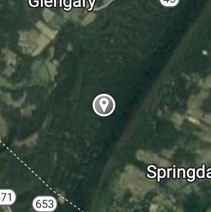
Target location: The target location represents the location of the target pixel set by the user. Your tool could include a reference base map (see the Mapping Resources listed in the Resources) and allow the user to define the target location by either entering latitude and longitude, place name, or by placing a pin on a map. See the example below.
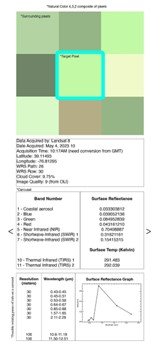
Mapping location with target pixel: As shown in the example image below, your tool could display:
the target pixel within a reference grid map of 3x3 pixels surrounding the target pixel.
the Landsat scene metadata.
the SR data in graphical form.
Landsat Scene Extents (WRS-2): Each Landsat scene measures 185 kilometers (115 miles) by 180 km (112 miles) and is arranged into paths and rows based on the Worldwide Reference System-2 (WRS-2). Paths are separated into rows based on lines of latitude as Landsat satellites move along a near-vertical path from pole to pole in a descending (daytime) pass. The United States Geological Survey (USGS) Landsat Acquisition Tool (see the Satellite Tracking Resources in the Resources) displays the Landsat acquisition calendar and pending Landsat acquisitions and provides an option to convert WRS paths and rows to points of latitude and longitude.
Landsat Acquisitions:Landsat 8 and Landsat 9 orbit Earth at an altitude of 705 kilometers (438 miles). Each satellite makes a complete orbit every 99 minutes, completes about 14 full orbits each day, crosses the equator at 10:00 am ± 15 minutes (mean local time), and crosses every point on Earth once every 16 days. Combined measurements from Landsat 8 and 9 provide for repeat measurements over the same location every 8 days.
Data Processing Times: Think about how your application can combine the capability of the Landsat acquisition tools with data processing tools to derive SR values for defined target locations. Newly acquired Level-1 Landsat 8 and Landsat 9 scenes become available for download typically less than 12 hours after data acquisition. The USGS Level-2 SR products are made available within 3 days for Landsat 9 and within 4 to 11 days for Landsat 8. For more information, you can access the Landsat Collection 2 Generation Timeline (see Resources).
Add-on functionality - Harmonized Landsat Sentinel-2 (see Resources): A more robust application could allow users to acquire ESA’s Sentinel-2 data. Harmonization of the Landsat and Sentinel-2 data is of paramount importance for the scientific community. The Harmonized Landsat Sentinel-2 (HLS) project provides consistent surface reflectance (SR) data from the Operational Land Imager (OLI) onboard the joint NASA/USGS Landsat 8 and Landsat 9 satellites and the Multi-Spectral Instrument (MSI) onboard Europe’s Copernicus Sentinel-2A and Sentinel-2B satellites. The combined measurements enable global observations of the land every 2–3 days at 30 meter (m) spatial resolution. The HLSS30 and HLSL30 products are gridded to the same resolution and Military Grid Reference System (MGRS) tiling and are “stackable” for time series analysis.
For data and resources related to this challenge, refer to the Resources tab at the top of the page. More resources may be added before the hackathon begins.
Background
The Landsat Program, administered by NASA and the U.S. Geological Survey, has improved our understanding of Earth systems, helped monitor environmental change, and informed decision-making about our planet’s natural resources. Landsat’s data archive provides the longest continuous remotely sensed record of multispectral, highly calibrated, medium spatial resolution (15 ⎼ 100 m) measurements of Earth’s land surface. The two most recent missions, Landsat 8 (launched in 2013) and Landsat 9 (launched in 2021), collectively deliver complete coverage of Earth’s land surface every eight days.
Free and open data from Landsat offers over fifty years of satellite-based Earth observations to engage members of the public and enable them to learn how Earth is changing. For example, students can compare Landsat data with ground-based spectral measurements from low-cost, educational tools they build themselves (e.g., the Science and Technology Education for Land/Life Assessment STELLA spectrometer). Comparing ground-based measurements with Landsat data can help students connect satellite observations with the landscape, enhance remote sensing education, and cultivate an understanding of data validation. Validation is the process of evaluating the accuracy of satellite-derived data through comparisons with ground reference data. This practice ensures that measurements collected by space-based sensors accurately represent what is happening on the ground. Validation is an essential component of any Earth observation program since it enables the independent verification of physical measurements.
To compare ground-based spectral data with Landsat data, it is necessary to know when Landsat will pass over a certain land area. An application that notifies users when Landsat will pass over a designated area and allows them to download the corresponding Landsat spectral data can inspire experiential learning activities to encourage scientific exploration, foster interdisciplinary and spatial thinking skills, and empower individuals to become informed global citizens.
While such an application could primarily serve as an educational tool, it could also support scientists, citizen scientists, and land managers. For example, it could facilitate the acquisition of near-real-time Landsat SR measurements, which could then be accessed, downloaded, and applied by other Landsat data users. Additionally, this application could support scientists in the collection of ground reference data to further Landsat data validation.
Objectives
Your challenge is to develop an easy-to-use, web-based application that supports the comparison of ground-based observations with Landsat data by allowing users to define a target location, receive notifications when Landsat is to pass over that location, and then access and display the corresponding Landsat SR data.
Think about how your tool can:
Allow users to define the target location. Will they specify the place name, latitude and longitude, or select a location on a map?
Determine when a Landsat satellite is passing over the defined target location.
Enable users to select the appropriate lead time for notifications about the overpass time and the method of notification.
Display a 3x3 grid including a total of 9 Landsat pixels centered on the user-defined location (target pixel).
Determine which Landsat scene contains the target pixel using the Worldwide Reference System-2 (WRS-2) and display the Landsat scene extent on a map.
Allow users to set a threshold for cloud coverage (e.g., only return data with less than 15% land cloud cover).
Permit users to specify whether they want access to only the most recent Landsat acquisition or acquisitions spanning a particular time span.
Acquire scene metadata such as acquisition satellite, date, time, latitude/longitude, Worldwide Reference System path and row, percent cloud cover, and image quality.
Access and acquire Landsat SR data values (and possibly display the surface temperature data from the thermal infrared bands) for the target pixel by leveraging cloud data catalogs and existing applications.
Display a graph of the Landsat SR data along the spectrum (i.e., the spectral signature) in addition to scene metadata.
Allow users to download or share data in a useful format (e.g., csv).
These are only some of the functions your tool could perform. Feel free to be creative and add expanded functionalities to create an even more effective and integrated application!
Potential Considerations
You may (but are not required to) consider the following:
For data and resources related to this challenge, refer to the Resources tab at the top of the page. More resources may be added before the hackathon begins.
No ideas yet.